
At roughly halfway through 2022, the S&P 500 continues to decline. How does this compare to previous years? What can history tell us? Are there any positives to the current situation?
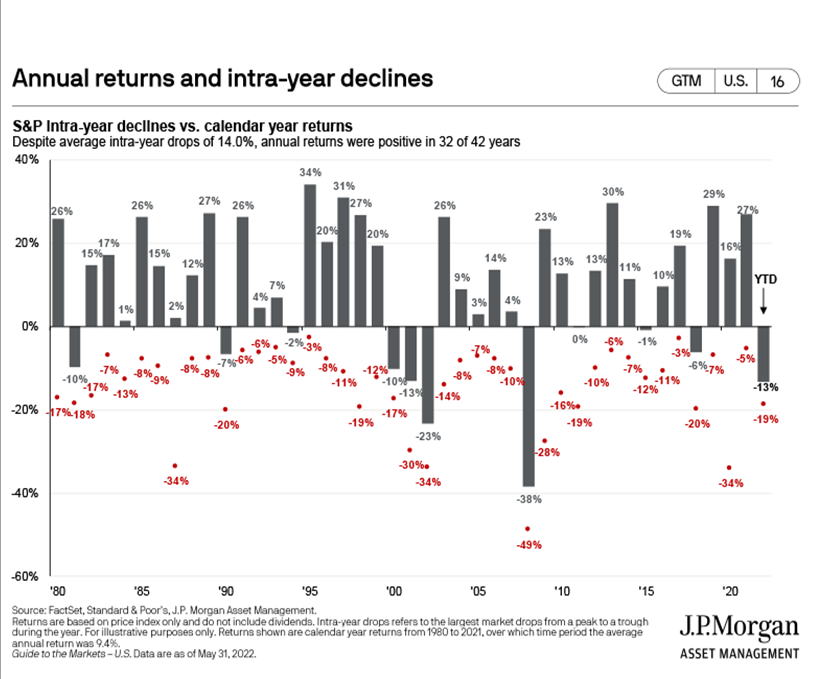
As we approach the halfway point of 2022, we find investor and consumer sentiment struggling with stock market volatility and economic inflation. These periods of time are somewhat normal, yet not pleasant. The S&P 500 Index has had a “correction” (decline of 10% or more) approximately once every 2 years. Since 1980, the S&P 500 has had an average drawdown of 14.0% over the course of a calendar year. This means the stock market “historically” declines 14% from its peak once a year, on average. The chart below, from JP Morgan, shows calendar year returns for the last 42 years which are indicated by the bar lines. The dots show the maximum drawdown or decline in that particular calendar year from its peak. When looking at the last 42 years, the S&P 500 Index has had 32 positive calendar year returns and only 3 years with a decline greater than 10%.

There are a couple of different ways to look at the increased volatility when it occurs in your investment portfolio. On one hand, more volatility can take a psychological toll on investors and increase the possibility of making a mistake. For example, selling after the decline and buying back after the recovery. On the other hand, more volatility may mean more opportunities to buy or rebalance at lower prices. If you’re investing on a regular basis these corrections can be a good thing and can create opportunities to purchase stocks “on sale”. Generally, most investors should prefer down markets when they are in accumulation mode.
When relying on an investment portfolio for life-time income, allocation to dividend stocks, fixed income, REITs and cash should provide stability & income to weather a correction or a bear market.
Start a conversation to learn more about who we are and what we do. Our team is ready to make an impact.
Contact Us